Google Ads & Facebook Ads: The 3 Metrics You Need to Scale

- By Warren Thompson
- 7 min read

You’ve got your Google and Facebook Ads campaigns running, and fingers crossed, they look like they’re off to a great start!
You researched essential keywords and high-value audiences, checked formatting carefully, and triple-checked your grammar.
Your CPCs are low, and you’ve carefully allocated your budget across Google and Meta (Facebook & Instagram).
Google Analytics shows that your traffic is increasing, you’re getting positive responses from customers or clients, and everything looks positive.
Your CEO looks at the figures and says, “That’s great! So, how do we scale things up? What KPIs are you paying attention to?”
Now, you could do what most marketers do and get lost in the weeds of CPMs, Impressions, Clicks, CPCs, CTRs, Average Session Duration, Engagement Rate, Video View Rate, blah blah blah…but this will likely confuse everyone in the room who isn’t a digital marketer.
So, how do you keep things simple and aligned with the business’s success? How do you filter through the mess of metrics to only highlight the most important KPIs?
Well, the good news is you don’t need a PhD in statistics to know if your campaigns are performing; you just need to know three key metrics. This will keep things clear, making it easy to communicate with your CEO or boss so that you can gain their confidence and increase your marketing budget and impact.
So, what are the three essential metrics you need to scale?
The three metrics here assume that your data is accurate and current. With appropriate data, you can accurately use these metrics to scale up your advertising campaigns. Don’t trust your data? Book a call with our team. We’ve helped over 100 companies solve that with a proper marketing analytics setup.
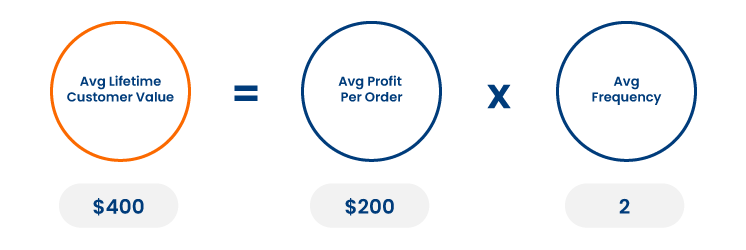
The average lifetime customer value is simple: the average profit per order multiplied by the average order frequency during a given time period. We like to use one year as a general rule, but you may want to use 90 days if you’re a startup or small business.
Avg LTV = Avg Profit Per Order x Avg Frequency
As a simple example,

It’s simple: There are only three ways to grow your business.
Calculating your Average LTV gives you the Average Order Value (AOV) and Frequency, which shows how much you can afford to pay for new customers and stay profitable.

Again, this is a simple metric: add up all the costs you spent on acquiring more customers during a period and then divide it by the number of new customers you acquired during that period.
Avg Customer Acquisition Cost = Marketing & Sales Costs / # of Customers
As part of a straightforward example,
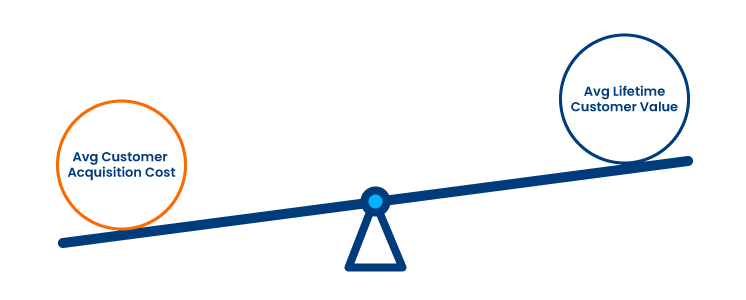
This tells you how much you spend on acquiring each new customer, which you can compare to your LTV. This creates a ratio, and ratios can tell us a surprising amount.

You should be getting roughly three times more from the customer than you spend on acquiring them, which is a ratio of 3:1.
It might make sense for some businesses to have a 2:1 ratio, especially in highly competitive fields or firms with a slower lifecycle (such as those offering maintenance or long-term service contracts).
A 4:1 ratio might also make sense in some high-turnover businesses, such as those that focus on producing novelty products or services.
For most, however, a 3:1 ratio is the sweet spot. This ensures sufficient profit to power the business while also ensuring that you don’t miss out on prospective business by underspending.
Note that you may have a 2:1 ratio on Facebook Ads and a 4:1 ratio on Google Ads, and that might be a perfect media mix to create awareness while continually driving conversions for your business.
If you are stuck at a 1:1 LTV:CAC ratio, you won’t be able to scale quickly without outside investment. And that outside investment can rapidly start to affect what you can do and how you can do it. That’s why it’s essential to understand this particular ratio. Understanding it also lets you know how you can affect it to shift your business onto a more profitable footing.
Both of these important metrics are essential, but they are both long-term strategic metrics. These are both known as lagging indicators because they must be calculated at the end of a set period.
However, we need at least one leading indicator to indicate what’s working in the short term.
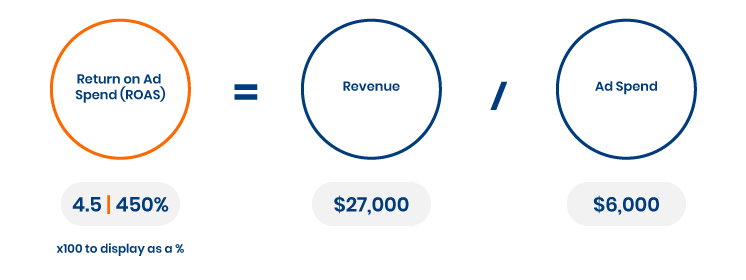
Metrics talk. And Breakeven ROAS says, “Don’t perform below this mark.” Breakeven ROAS is the percentage return you need to achieve so you don’t lose money. It’s your lowest limit. But first, you need to work out your actual return on ad spend:

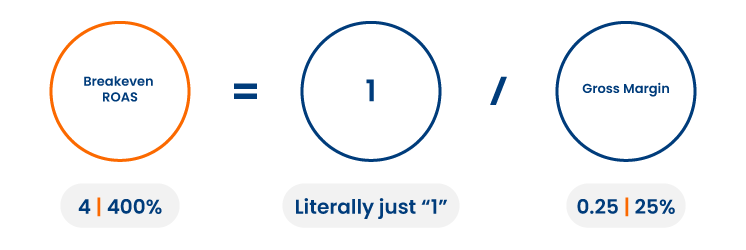
Next, you need to work out your breakeven return on ad spend:

As long as your actual return on ad spend is higher than your breakeven return on ad spend, you’re good.
So, at this stage, you have your leading indicator, which is your breakeven ROAS vs. actual ROAS. As long as that is healthy, your LTV:CAC ratio should be healthy, which means your overall advertising strategy is healthy (see how these things are connected!).
Regularly checking these ensures that you can take action to modify or refocus your advertising campaigns, allowing you to scale much more quickly.
Any business can use ROAS—that’s the beauty of that metric. However, some companies, notably those that are primarily lead generators, suit a slightly different leading indicator: Cost Per Lead (CPL).
You might know your Average CPL, but how do you find your Target CPL? And how do you pick a target that’s profitable? To find out, you’ll first need to calculate your Average Profit Per Lead (PPL).
How to calculate Average Profit Per Lead (PPL).
If you have ten leads that convert into two prospects and one customer, you have a
You then multiply your Average LTV (based on profit) by the qualification and close rates to find your Average Profit Per Lead.
Taking the example above and assuming a $3,000 LTV, you get:

You then calculate your PPL:CPL ratio. Ideally, it should be a 3:1 ratio or thereabouts.
Typically, you zoom out to review your LTV:CAC ratio over a longer time horizon, like 3-6 months, and then zoom in to check your ROAS or target CPL on a monthly, weekly, and daily basis.
This gives you a good idea of your business’s short-term and long-term health. Ultimately, you will have the data to plan for long-term strategic initiatives while being able to react and make quick tactical decisions.
This long and short-term view is the holy grail of performance data for any business or marketing team!
Remember that you can also use these metrics to compare the performance of different segments. Segmentation allows you to understand and optimize your marketing and scale up high-value segments. For example:
Most importantly, you need reliable, accurate data so that you can trust the very foundation of what you are using to measure success.
At Ollo Metrics, we’ve helped over 100 businesses transform the way they measure performance data, gaining them accurate, compliant, and trustworthy analytics.
Using a data-first approach, our team develops effective SEO, Facebook, Google and LinkedIn Ad strategies to maximize ROI. Book a call with us today to see how we can help you use digital marketing to grow your business.
Sign up to get monthly digital marketing & analytics tips, tools and trends to grow your business with confidence.
Be generous and share this article with your friends
We are a Digital Marketing Agency in Vancouver, BC, Canada. We specialize in Google Ads, Social Media Ads, and SEO (Search Engine Optimization). What makes us different from other agencies is that we place a heavy emphasis on marketing analytics to help connect the dots between marketing costs and revenues generated.
Be the first one invited to our hands-on workshops, and get updates on our latest digital marketing blog releases.