Marketing KPI Dashboards for Each Level of Your Organization
Creating a System and Culture of Data-Driven Performance in Your Organization.

- By Warren Thompson
- 7 min read
Creating a System and Culture of Data-Driven Performance in Your Organization.

Here’s something that most digital marketers don’t want you to hear…
“You don’t need to know the ins and outs of digital marketing in order to manage it effectively.”
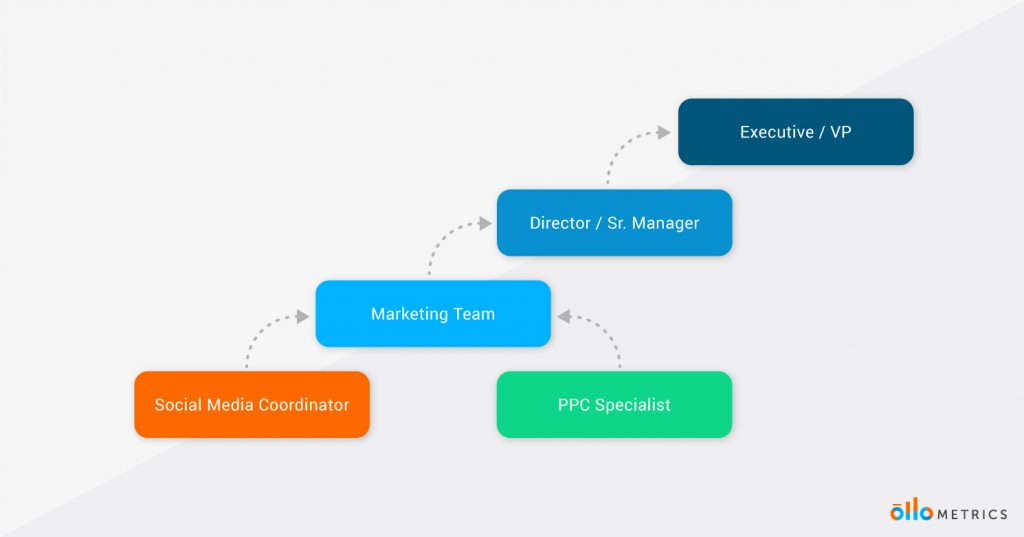
Do you believe me? You soon will. With the right marketing KPI dashboards, you can get a full end-to-end picture of your organization’s marketing efforts all the way from the executive to an individual on the marketing team.
As a business decision maker, the hardest and most frustrating part of leading your company in today’s world of digital marketing and media fragmentation is that there are way too many moving pieces.
It used to be easy… Buy a radio ad, a TV spot, a run of newspaper ads, maybe a direct mailer around your store locations and hit the country club for the afternoon back 9 special.
Now there are thousands of different tactics that you can use to get your brand’s message in front of people online and trusting a media rep to ‘just take care of it for you’ will most certainly end up with over half of your budget down the digital toilet. As the famous quote goes:
This makes it very difficult to develop an effective digital marketing strategy that you are in control of, especially while trying to manage everything that’s already on your plate.
However, there is a way… Although digital marketing can seem to be more fragmented and confusing than traditional media, its measurability makes it much easier to manage as long as you’re getting the right information to the right people at the right time.
And how do you do that?
Three words: Multi-Level Dashboards or MLDs if you prefer. (It wouldn’t be a marketing article without at least one TLA.)
MLDs can easily apply to every department within your organization, but for the purposes of this article, we’ll primarily focus on marketing KPI dashboards.
As a senior person in your organization, you don’t have time to stare at real-time web analytics reports any more than you have time to answer every customer phone call that comes in.
The same rule applies to every team member and department within your organization. Your social media marketer doesn’t have time to attend quarterly directors’ meetings. They’re too busy building your community and presence online!
Multi-Level Dashboarding puts the right information in front of the right people at the right time.
What’s the right information?
“The right information is the information that, if acted upon, will have the greatest business impact based on your organization’s size and Key Business Objectives (KBOs).”
This is dependant on who is viewing the information and the timeframe in which that information is presented (more on that later).
A Multi-Level Dashboarding strategy involves breaking down each department, team, person, and function within your organization to identify the relevant metrics and information that drive success. Then, building a level-specific dashboard to measure those metrics so that each unit can consistently improve performance over time.

A question some of you might have at this point is: “But we’re only a 3-person operation. Do we really need this? It seems like something for Fortune 500 companies…”
Great point. However, there are two key factors to consider when thinking about a “Multi-Level” strategy:
Neither of these factors actually require different people to be viewing different information. The larger your organization, the more specialized the roles will be and, therefore, each person will need different information. However, even if you’re only a one-person operation, you’ll need different information at different time intervals depending on the context of what you are working on and when you’re working on it.
The best starting point is to focus on your business’ KPIs (or Key Performance Indicators). KPIs are your most mission-critical metrics that measure the success of the activities you’ve performed to meet your business’ goals. They should be measured against specific targets or benchmarks which will add more context to each activity you are performing.
Which goals should you be measuring?
Your business’ goals will always relate to high-level Key Business Objectives (KBOs). We’ll dive deeper into goals and KBOs in a future article, but for now, a quick exercise to point you in the right direction.
We’ll keep it simple with KBOs focused on financial growth here. Find a quiet place to think. Then, answer these two questions:
QUESTION 1: “Which Key Business Objectives are the most important for growing my business right now?” (select from the list below).
QUESTION 2: How will you know if you’ve achieved it? What metric(s) can you use to measure success?
These are your KPIs. They are the most highly-relevant metrics that indicate the success of the KBOs above. Note that your KPIs shouldn’t be created and implemented in a vacuum. They should be discussed and vetted with all the appropriate people at the table, which will also have the added benefit of increasing buy-in from everyone involved.
You may already have KBOs and KPIs set for your business, but next, we’ll be looking at how to connect the dots from KPIs to the specific marketing metrics that affect them. Getting this information into a marketing analytics dashboard will give you the full end-to-end picture of your marketing program so that you can manage all the moving pieces more effectively.
A dashboard gives you a dedicated frame to view your metrics within. It is time-specific, consistent, and visually accessible. Many marketing KPI dashboards are also now interactive, giving you more context and allowing for quick access to deep data dives within a single view.
If you have to dig through reports in isolation, you can miss important insights and connections that otherwise would’ve been spotted in a dashboard. Dashboards, when implemented correctly, also improve communication between teams and departments.
Pro Tip: Having a comments area for Observations and Recommended Actions will get multiple minds working together to solve problems and move that needle forward.
The advantages of Multi-Level Dashboarding are more evident when you consider the opposite.
What if everyone in your organization was measuring their individual success by the exact same metrics each day? (Your warehouse staff probably wouldn’t be too proud of their SQL-to-close ratio.)
Silly right?
Similarly, if you are sifting through pages and pages of metrics that you are unable to act upon and influence, then you are diluting your focus from the real metrics that matter to you and your department at that moment.
Here we want to take our KPIs and map them to the leading indicators within each department, team, and individual that influence the outcomes of those KPIs. I like to call this process Cascading KPIs.
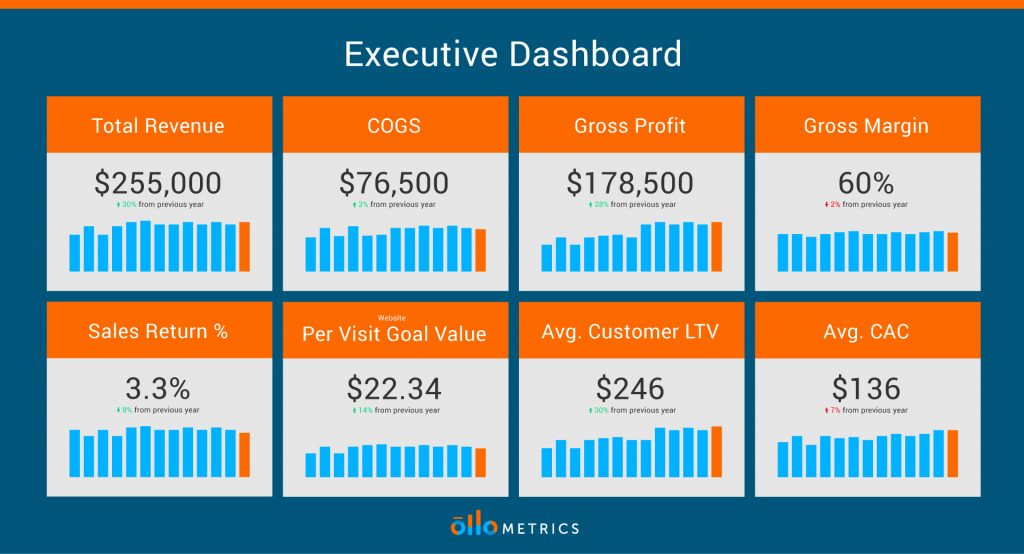
Popular footwear retailer Laces & Lasts wants to track Average Customer Lifetime Value (LTV) to know how much each new customer is worth to them. Let’s break down Average Customer LTV into all of the leading indicator metrics within each department, team, and individual that contribute to its success and, more importantly, can be acted upon.
At the Executive/VP level here are some suggestions. However, yours will be different depending on what is important to your business:
And here’s what that can look like in an Executive Marketing KPI Dashboard. Want one for yourself? Contact our team.

Now, at the Director or Senior Manager level you’ll want a bit more detail on the contributing factors that led to overall Average Customer LTV:
Finally, how about the Customer Service Team?
There are more places that this can go! We didn’t even dig into Average Customer LTV’s twin brother: Customer Acquisition Cost. But as you can see, we’re able to unpack a single KPI such as Average Customer LTV into many different leading indicators depending on who needs the information and how they’re able to act upon it.
The primary reason for measuring the results of anything is to gather feedback and alter your behaviour going forward. This is why finding the right KPIs for your organization is so crucial. If you are not gathering the right feedback, you won’t be able to make the right adjustments to your behaviour.
As the saying goes: “Measure what matters”. However, I’d like to add to that famous quote by saying “Measure what matters NOW”. And THIS is where MLDs will be a real game-changer for you.
The problem with many higher-level strategic KPIs is that they are ‘lag measures‘. That means they tend to have a longer time horizon before they can become useful as an action item. This is the natural relationship between strategy and tactics. Think of your business: You have longer-term strategies which may elapse multiple months or even years and tactics which can be a single weekend sales promotion or blog post.
KPIs and other metrics are just measures of those efforts. Average Customer LTV, in our last example, can’t be viewed and acted upon every week. It requires a certain time period to measure the data. Therefore, it requires more time to take the necessary actions to improve it.
However, by taking that single metric and mapping it down to multiple ‘leading indicators‘ in each department, we’re able to improve our reaction time and agility as an organization by monitoring the performance of each lead domino.
In the 7 Habits of Highly Effective People, Stephen Covey beautifully outlined two styles of delegation and the resulting impact of each.
There’s also a quote from business author Mack Story that says “Delegating ‘what to do’ makes you responsible. Delegating ‘what to accomplish’ allows others to become responsible.”
By empowering a department, team, or individual within your organization with a clear set of desired results and a dashboard, they will be able to effectively manage themselves and be responsible for the outcome.
This will shift the team dynamic from you having to ask “why are the numbers down?” to them approaching you and saying “We noticed our numbers are down, here’s what we think will fix it”.
Which scenario would you prefer?
One caveat of dashboarding or ‘business intelligence’ in general is that it requires action in order to be effective. That means that the information needs to be action–able.
Many digital marketers and/or marketing agencies are guilty of vomiting excessive amounts of data into dashboards and presentations in order to look smart or impress their bosses and/or clients. Furthermore, without proper measurement and analytics setup (much more common than you think), the majority of this data is only about 70% accurate or trustworthy at best – Not exactly ideal for basing important business decisions upon.
Working with experienced professionals to set up, customize, manage, and report on your most important metrics and their leading indicators will give you the confidence to make better business decisions and measure their impact.
One last quote to leave you with: “Without knowledge, action is useless and knowledge without action is futile” – Abu Bakr
Interested in making Multi-Level Dashboarding an instrumental part of your organization’s success? Talk to an Ollo Metrics Expert about marketing analytics dashboard now to learn more.
Sign up to get monthly digital marketing & analytics tips, tools and trends to grow your business with confidence.
Be generous and share this article with your friends
Be the first one invited to our hands-on workshops, and get updates on our latest digital marketing blog releases.